This post was originally published on this site
Shares of airline companies traded mostly lower Monday, as travel demand has been hurt by the continued surge in new COVID-19 cases brought on by the spread of the highly infectious delta variant.
An airline sector tracker, which has been trending lower for the past five months, has produced a bearish “death cross” chart pattern, which could be a warning of further weakness.
The U.S. Global Jets exchange-traded fund
JETS,
fell as much as 2.1% intraday, before paring losses to close down 0.8%.
Among the more-active components, shares of American Airlines Group Inc.
AAL,
slipped 0.4%, Delta Air Lines Inc.
DAL,
edged up 0.1%, United Airlines Holdings Inc.
UAL,
gave up 0.4%, JetBlue Airways Corp.
JBLU,
fell 1.4%, Southwest Airlines Co.
LUV,
slid 0.6% and Spirit Airlines Inc.
SAVE,
dropped 1.9%.
Transportation Security Administration data showed that the daily average of people going through its security check points in the past week (through Sunday) fell to 1.94 million from 1.99 million the week before.
It was the second straight week the average was below 2 million after four straight weeks above 2 million, and was the lowest level recorded since the week ended June 20, according to a MarketWatch analysis of TSA data.
The slowdown comes as Southwest disclosed last week that it has seen a deceleration in bookings and trip cancelations in August, which it believes are because of the recent rise in COVID-19 cases associated with the delta variant. The air carrier said its outlook for third-quarter revenue has worsened by three-to-four percentage points as a result, and “will make it difficult” to be profitable for the quarter.
Don’t miss: Cities begin to roll out COVID-19 vaccination rules as cases in the U.S. hit a six-month high.
Also read: Discouraged by travel sticker-shock? Try these ways to make a trip both fun and budget-friendly.
B. of A. Securities analyst Andrew Didora said in a research note Monday that the recovery in business travel, which has been much weaker than the recovery in leisure travel, “may be modestly pushed out given the current environment.”
Didora noted that many air carriers estimated in recent weeks that corporate demand should improve to be down 40% to 50% by this fall. Meanwhile, the most recent data showed that domestic tickets sold through large corporate channels was down 55.7%, compared with down 53.9% last week, he said.
And that’s not all: “U.S. airlines’ website visits decelerated to up +2% for the week ending 8/11 vs. 2019 levels, compared to up +6% last week and have been slowing declining since early July,” Didora wrote in a note to clients.
The Jets ETF has shed 14.7% over the past three months, while the Dow Jones Transportation Average
DJT,
of which 6 of its 20 components are airlines, has lost 5.4% and the Dow Jones Industrial Average
DJIA,
has gained 3.8%.
‘Death cross’ pattern appears in Jets ETF chart
A chart of the Jets ETF (JETS), which has been steadily declining over the past several months, has produced an ominous-sounding technical pattern known as a “death cross,” which warns of further potential losses.
JETS started soaring in late 2020 and in early 2021, as the administering of COVID-19 vaccines sparked investor interest in reopening trades, particularly in sectors most hurt by the pandemic earlier in 2020, such as airlines.
That reopening rally helped produce a “golden cross” in mid-November, which is when the 50-day moving average (DMA) crosses above the 200-DMA. Many chart watchers believe a “golden cross” marks the spot that a shorter-term rally graduates into a longer-term uptrend.
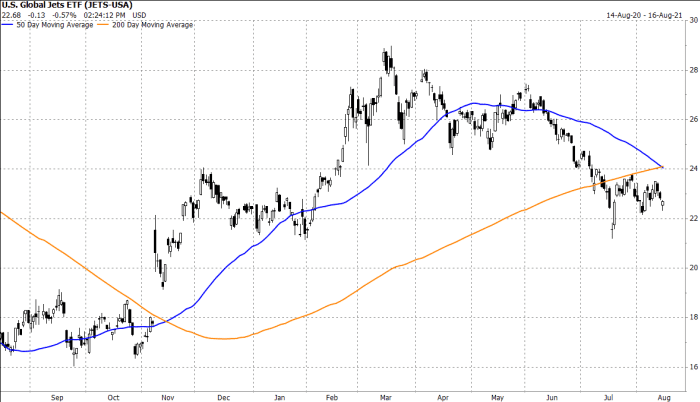
FactSet
The ETF reached a 13-month high of $28.71 on March 15, which at the time marked a 28.3% year-to-date rally, compared with a 5.7% gain for the S&P 500 index
SPX,
over the same time.
JETS was recently trading about 21% below its March peak, as the interest in reopening stocks has faded.
That decline has now produced a “death cross,” which is the opposite of a “golden cross.” The 50-DMA, which many use as a short-term trend tracker, fell to $24.04 on Monday from $24.12 on Friday, according to FactSet, while the 200-DMA, which is seen as a dividing line between longer-term uptrends and downtrends, rose to $24.11 from $24.08.
Keep in mind moving average crosses aren’t necessarily good market-timing tools, since they are well telegraphed, but they can help investors acknowledge that the recent trend has lasted long enough and/or extended far enough to at least consider adjusted their stance on the longer-term outlook.
The last “death cross” appeared on March 5, 2020, about a week before COVID-19 was declared a pandemic. JETS tumbled another 44.6% before it bottomed out at $12.00 on May 15, which was the lowest close since it started trading in April 2015.
The technical trouble for JETS started about a month before the “death cross” appeared.
The ETF closed below the 200-DMA on July 13, for the first time since Nov. 6, 2020, to warn of a transition to a longer-term downtrend. The stock hasn’t been able to close above the 200-DMA since.
