This post was originally published on this site
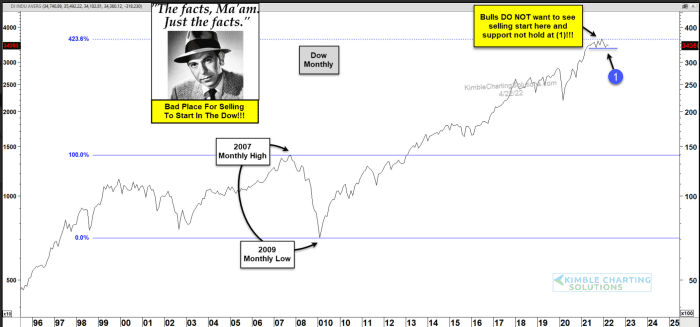
The stock market’s Friday plunge will have market bulls looking for the Dow Jones Industrial Average to hold important support tied to the market’s gyrations all the way back to the 2007-09 financial crisis, technical analyst Chris Kimble said on Friday.
In the chart below, the founder of Kimble Charting Solutions applied Fibonacci analysis to the blue-chip gauge’s
DJIA,
monthly 2007 highs and 2009 lows. He found the “423% Fibonacci extension level” looked to be influencing the Dow over the past six months.
Kimble Charting Solutions
Many technical analysts pay attention to what’s known as the Fibonacci ratio, attributed to a 13th century Italian mathematician known as Leonardo “Fibonacci” of Pisa. It’s based on a sequence of whole numbers, in which the sum of two adjacent numbers equals the next highest number (0,1,1,2,3,5,8,13, 21…).
Technical analysts see key retracement targets for a rallies or selloffs at 38.2%, 50% and 61.8%, while retracements of 23.6% and 76.4% are seen as secondary targets. Chart watchers also employ multiples, such as 23.6%, 161.8%, 423% and so on.
“If Dow closes out the month below the 33,000, odds increase that the Dow will experience more selling. What the Dow does at support, looks to be very important to bulls and bears,” Kimble wrote.
A test of 33,000 would mark a fall of 2.4% from its close Friday at 33,811.40. The Dow plunged 981.36 points, or 2.8%, on Friday — its biggest one-day percentage fall since October 2020, leaving it with its lowest close since March 15. The S&P 500
SPX,
tumbled 2.8%, while the Nasdaq Composite
COMP,
lost 2.5%.
